As I have described elsewhere, let's say you have predictor variable $X$, outcome $Y$, and a variable $M$ that you think transmits the impact of $X$ on $Y$. You can think of this situation in terms of the following diagram:
The path $a$ represents the impact of $X$ on $M$, and the path $b$ represents the impact of $M$ on $Y$. The degree to which $X$ exerts its impact on $Y$ through $M$ can be represented as the product $ab$. The degree to which $X$ exerts its impact through other mechanisms can be represented by $c$. Paths $a$, $b$, and $c$ can be estimated using the following two statistical models:
$$M = aX + e_1$$
$$Y = bM + cX + e_2$$
This approach to statistical mediation is almost certainly overused. Without randomization of $X$, the magnitude of $ab$ tells us almost nothing about the underlying causal structure of the three variables in our model. In fact, even with randomization for $X$, a design that lacks randomization for $M$ also won't tell us much about the underlying causal structure, as in this situation the estimators $b$ and $c$ are both biased (Bullock, Green, & Ha, 2010). Finally, getting good estimates of the indirect effect requires a lot of data -- almost certainly more than is typically used.
On the other hand, just as examining correlations in observational studies can help us think through the universe of possibilities that produce that correlation, statistical mediation models can help us think through the universe of possibilities that produce the mediation model. We must always bear in mind the assumptions that underlie these models, but as long as we remember these assumptions the exercise can still be fruitful.
In contrast to a two-variable correlational analysis, however, a mediation analysis involves three variables and two interdependent statistical models. Thus, a mediation analysis is more difficult to think about. Personally, I have found my intuitions about mediation to be poorly tuned to the underlying math.
To improve these intuitions, I tried to anchor them in a concept about which I have somewhat better intuitions -- the correlation coefficient. If we assume that $X$, $M$, and $Y$ are standardized, there are well-defined mathematical relationships between the quantities $a$, $b$ and $c$ and the correlations between $X$, $M$, and $Y$.
Let's assume that we have the following correlation matrix:
$$
\begin{array}{c|ccc}
&X&M&Y\\
\hline
X&1&&\\
M&r_{XM}&1&\\
Y&r_{XY}&r_{MY}&1
\end{array}
$$
\begin{array}{c|ccc}
&X&M&Y\\
\hline
X&1&&\\
M&r_{XM}&1&\\
Y&r_{XY}&r_{MY}&1
\end{array}
$$
The relationships between the correlations in this matrix and the quantities $a$, $b$, and $c$ can be derived by the path-tracing rules. They are given as follows:
$$
\begin{array}{c|ccc}
&X&M&Y\\
\hline
X&1&&\\
M&a&1&\\
Y&ab + c&ac + b&1
\end{array}
$$
\begin{array}{c|ccc}
&X&M&Y\\
\hline
X&1&&\\
M&a&1&\\
Y&ab + c&ac + b&1
\end{array}
$$
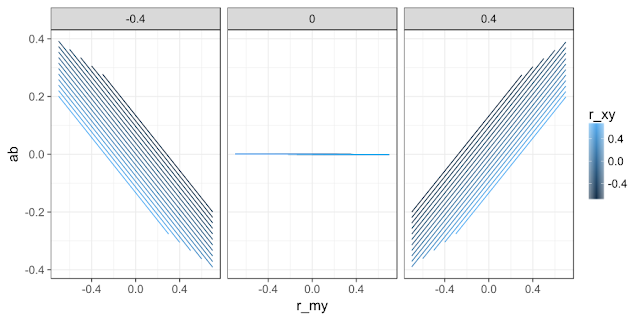
To help visualize these relationships, I ran a simulation to see what would happen to the magnitude of the indirect effect estimate $ab$ if we systematically vary the magnitude of the correlations between $X$, $M$, and $Y$. You can find the code here, but the gist of what I did is, for each of several sets of values for $r_{XM}$, $r_{XY}$, and $r_{MY}$, simulate a dataset with 100,000 cases (so sampling error isn't much of an issue), fit regression models to estimate $a$ and $b$, then calculate their product. Here's a graph of the results.
When $r_{XM}=0$, a non-zero mediation effect is impossible. This makes good sense, as $r_{XM}=a$, and the mediation effect is estimated as $ab$.
When $r_{XM}$ takes on non-zero value, increasing the value of $r_{XY}$ (the correlation between the manipulation and the outcome) makes the mediation effect more positive. This makes some sense in that $r_{XY}$ represents the total effect of the manipulation on the outcome, and a larger total effect means there is a larger potential effect for the mediator to explain. However, this intuition is imperfect because there are some situations where making $r_{XY}$ more positive brings the mediation effect closer to 0 (for example, the lower right part of the $r_{XM}=-.4$ panel).
The effect of increasing $r_{MY}$ (the correlation between mediator and outcome) depends on whether $r_{XM}$ is negative or positive. When $r_{XM}$ is negative, increasing $r_{MY}$ yields decreases in the mediation effect. When $r_{XM}$ is positive, increasing $r_{MY}$ yields increases.
I don't mean for this to be a rigorous, exhaustive study of the mathematics behind mediation. But I do find it useful to see visually how tweaking the simple bivariate correlations between these variables changes the magnitude of the indirect effect.


No comments:
Post a Comment